

Predefined Charts
Charts can be displayed using appended dollar sign before the chart name you with to use. For example {$chart_bar_severity_count}
Types of charts
Section titled “Types of charts”We support multiple types and styles of charts. Customization in terms of colors and style is done by using native MS Word functions, PentestPad will just populate the data.
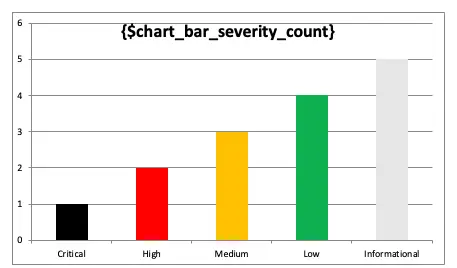
chart_bar_severity_count
Section titled “chart_bar_severity_count”A bar chart displays the risk matrix, showing the severity of findings based on impact and probability calculations, with results grouped by category count.
chart_bar_cvss_severity_count
Section titled “chart_bar_cvss_severity_count”A bar style of CVSS v3.1 calculated severity of the findings and grouped by count per each category.
chart_vuln_severity
Section titled “chart_vuln_severity”Non-bar style of chart displaying the risk matrix, showing the severity of findings based on impact and probability calculations, with results grouped by category count
chart_vuln_cvss_severity
Section titled “chart_vuln_cvss_severity”Non-bar style of CVSS v3.1 calculated severity of the findings and grouped by count per each category.